Congressional Influence
Let’s take another look at congressional data. This data is covers 5,000 legislative bills that were sponsored in Congress over 411 representatives (or the equivalent), 50 states (including some additional US territories) and 759 “subjects” (eg abortion, health, education, etc). In this notebook, we will learn the network structures for states with more than 5 districts. The idea is to understand the influence of one district on the rest of the districts (within a state). For example, if Nancy Pelosi sponsors a bill, then what is the influence of this sponsorship on other representatives also sponsoring the bill? We compute the influence using lift, which is just the posterior probability divided by the marginal probability.
Load data
Let’s load the data.
[182]:
import pandas as pd

def get_pdf(state):
    cols = [c for c in pdf.columns if c.startswith(state)]
    return pdf[cols]

pdf = pd.read_csv('./data/congress-influence.csv', low_memory=False) \
    .drop(columns=['legislation'])

meta_pdf = pd.read_csv('./data/congress-meta.csv', low_memory=False) \
    .assign(state=lambda d: d['district'].apply(lambda s: s.split('_')[0])) \
    .set_index(['district'])

pdf.shape, meta_pdf.shape
[182]:
((4308, 441), (441, 3))
The bar graph below visualizes the number of districts in each state. CA has the most number of districts.
[28]:
s = pd.DataFrame(([(c, c.split('_')[0]) for c in pdf.columns]), columns=['district', 'state']) \
    .groupby(['state']) \
    .size() \
    .sort_values(ascending=False)

_ = s.plot(kind='bar', figsize=(12, 3), title='Number of districts per state', ylabel='n')
Now we convert the Pandas dataframe into a Spark one.
[20]:
from pyspark.sql import SparkSession

def get_sdf(state):
    return spark.createDataFrame(get_pdf(state)).cache()

spark = SparkSession \
    .builder \
    .appName('diabetes') \
    .master('local[*]') \
    .config('spark.executor.memory', '5g') \
    .config('spark.driver.memory', '10g') \
    .config('spark.memory.offHeap.enabled', 'true') \
    .config('spark.memory.offHeap.size', '5g') \
    .getOrCreate()

state_sdf = {state: get_sdf(state) for state in s[s > 5].index}
len(state_sdf)
[20]:
27
Learning
We are going to learn a Bayesian Belief Network (BBN) using the Maximum Weight Spanning Tree (MWST) algorithm for each state.
[32]:
from pysparkbbn.discrete.data import DiscreteData
from pysparkbbn.discrete.plearn import ParamLearner
from pysparkbbn.discrete.bbn import get_bbn
from pybbn.pptc.inferencecontroller import InferenceController
from pysparkbbn.discrete.scblearn import Mwst

def learn(sdf):
    d = DiscreteData(sdf)
    g = Mwst(d).get_network()
    p = ParamLearner(d, g).get_params()
    b = get_bbn(g, p, d.get_profile())
    t = InferenceController.apply(b)

    return {
        'data': d,
        'graph': g,
        'params': p,
        'bbn': b,
        'tree': t
    }
[33]:
_r = {state: learn(sdf) for state, sdf in state_sdf.items()}
len(_r)
23/09/13 11:36:31 WARN CacheManager: Asked to cache already cached data.
23/09/13 11:36:37 WARN CacheManager: Asked to cache already cached data.
23/09/13 11:36:40 WARN CacheManager: Asked to cache already cached data.
23/09/13 11:36:42 WARN CacheManager: Asked to cache already cached data.
23/09/13 11:36:43 WARN CacheManager: Asked to cache already cached data.
23/09/13 11:36:45 WARN CacheManager: Asked to cache already cached data.
23/09/13 11:36:46 WARN CacheManager: Asked to cache already cached data.
23/09/13 11:36:47 WARN CacheManager: Asked to cache already cached data.
23/09/13 11:36:48 WARN CacheManager: Asked to cache already cached data.
23/09/13 11:36:49 WARN CacheManager: Asked to cache already cached data.
23/09/13 11:36:50 WARN CacheManager: Asked to cache already cached data.
23/09/13 11:36:51 WARN CacheManager: Asked to cache already cached data.
23/09/13 11:36:52 WARN CacheManager: Asked to cache already cached data.
23/09/13 11:36:52 WARN CacheManager: Asked to cache already cached data.
23/09/13 11:36:53 WARN CacheManager: Asked to cache already cached data.
23/09/13 11:36:54 WARN CacheManager: Asked to cache already cached data.
23/09/13 11:36:55 WARN CacheManager: Asked to cache already cached data.
23/09/13 11:36:56 WARN CacheManager: Asked to cache already cached data.
23/09/13 11:36:57 WARN CacheManager: Asked to cache already cached data.
23/09/13 11:36:57 WARN CacheManager: Asked to cache already cached data.
23/09/13 11:36:58 WARN CacheManager: Asked to cache already cached data.
23/09/13 11:36:59 WARN CacheManager: Asked to cache already cached data.
23/09/13 11:37:00 WARN CacheManager: Asked to cache already cached data.
23/09/13 11:37:01 WARN CacheManager: Asked to cache already cached data.
23/09/13 11:37:02 WARN CacheManager: Asked to cache already cached data.
23/09/13 11:37:02 WARN CacheManager: Asked to cache already cached data.
23/09/13 11:37:03 WARN CacheManager: Asked to cache already cached data.
[33]:
27
Below is a visualization of all the graphical structures for each state.
[44]:
import networkx as nx
import matplotlib.pyplot as plt
import numpy as np

def plot_structure(g, title, ax):
    pos = nx.nx_pydot.graphviz_layout(g, prog='dot')

    nx.draw(
        g,
        pos,
        ax=ax,
        with_labels=True,
        node_size=10,
        node_color='#2eb82e',
        edge_color='#4da6ff',
        arrowsize=10,
        min_target_margin=5
    )

    ax.set_title(title)

def _plot_structure(_r, state, ax):
    plot_structure(g=_r[state]['graph'], title=f'{state} congressional influence', ax=ax)

fig, axes = plt.subplots(len(_r), 1, figsize=(20, 100))

for state, ax in zip(_r, np.ravel(axes)):
    _plot_structure(_r, state, ax)

fig.tight_layout()
Influence
Now let’s take a look at how some Congress members influence others.
[176]:
from pybbn.graph.jointree import EvidenceBuilder

def post_to_df(post, prefix):

    _data = [(k, v['no'], v['yes']) for k, v in post.items()]
    _data = pd.DataFrame(_data, columns=['district', f'{prefix}_no', f'{prefix}_yes']) \
        .set_index(['district'])
    return _data

def get_posteriors(t, district, sponsorship):
    ev = EvidenceBuilder() \
        .with_node(t.get_bbn_node_by_name(district)) \
        .with_evidence(sponsorship, 1.0) \
        .build()
    t.unobserve_all()
    t.set_observation(ev)

    _data = post_to_df(t.get_posteriors(), 'post')

    f = _data.index.isin([district])
    _data = _data[~f]

    return _data

def get_marginal(t):
    t.unobserve_all()
    _data = post_to_df(t.get_posteriors(), 'marg')
    return _data

def get_lift(t, district):
    _influencer = meta_pdf[meta_pdf.index == district].iloc[0]['name']
    _marginal = get_marginal(t)
    _pos = _marginal.join(get_posteriors(t, district, 'yes')) \
        .assign(
            lift_yes=lambda d: d['post_yes'] / d['marg_yes']
        ) \
        .dropna() \
        [['lift_yes']]
    _neg = _marginal.join(get_posteriors(t, district, 'no')) \
        .assign(
            lift_no=lambda d: d['post_no'] / d['marg_no']
        ) \
        .dropna()  \
        [['lift_no']]

    return _marginal \
        .join(_pos) \
        .join(_neg) \
        .join(meta_pdf) \
        [['lift_yes', 'lift_no', 'party', 'name']] \
        .dropna() \
        .assign(influencer=_influencer)
Nancy Pelosi
When Nancy Pelosi sponsors a bill, the lift of the other Congress members below also tend to sponsor the bill. Interestingly, Young Kim, a Republican, sponsors bills by nearly a factor of 3 when Nancy Pelosi also sponsors the bill.
[183]:
get_lift(_r['CA']['tree'], 'CA_11') \
    .sort_values(['lift_yes'], ascending=False) \
    .query('lift_yes > 1.1')
[183]:
| lift_yes | lift_no | party | name | influencer | |
|---|---|---|---|---|---|
| district | |||||
| CA_25 | 39.206005 | 1.005103 | D | Raul Ruiz | Nancy Pelosi |
| CA_06 | 15.040690 | 1.002292 | D | Ami Bera | Nancy Pelosi |
| CA_32 | 5.645276 | 1.001095 | D | Brad Sherman | Nancy Pelosi |
| CA_40 | 2.958387 | 1.000362 | R | Young Kim | Nancy Pelosi |
| CA_30 | 1.415824 | 1.000163 | D | Adam B Schiff | Nancy Pelosi |
| CA_47 | 1.102084 | 1.000044 | D | Katie Porter | Nancy Pelosi |
Alexandria Ocasio-Cortez
We notice that Alexandria Ocasio-Cortez’s bill sponsorship increases the lift of sponsorship for one other member from NY.
[184]:
get_lift(_r['NY']['tree'], 'NY_14') \
    .sort_values(['lift_yes'], ascending=False)\
    .query('lift_yes > 1.1')
[184]:
| lift_yes | lift_no | party | name | influencer | |
|---|---|---|---|---|---|
| district | |||||
| NY_16 | 11.386664 | 1.013153 | D | Jamaal Bowman | Alexandria Ocasio-Cortez |
Kevin McCarthy
Kevin McCarthy is the current (2023) House Republican Leader. His sponsorship increases the lift of only 2 other Congress members from his state.
[185]:
get_lift(_r['CA']['tree'], 'CA_20') \
    .sort_values(['lift_yes'], ascending=False) \
    .query('lift_yes > 1.1')
[185]:
| lift_yes | lift_no | party | name | influencer | |
|---|---|---|---|---|---|
| district | |||||
| CA_13 | 45.383949 | 1.000449 | R | John S Duarte | Kevin McCarthy |
| CA_01 | 4.827280 | 1.000154 | R | Doug LaMalfa | Kevin McCarthy |
CA influencers
In this analysis, we look at each CA Congres member’s influence on others and count how many times the lift is greater than 1.1. What bubbles out is that Nanette Diaz Barragan has the most lift. If you look at the BBN graph structure for CA, you will notice that she is at the nexus of a cluster of members. From the graph structure, she is influenced through many pathways (she is not a root influencer herself).
[190]:
influence_df = pd.concat([get_lift(_r['CA']['tree'], district)
                          for district in meta_pdf[meta_pdf['state'] == 'CA'].index])
influence_df.shape
[190]:
(2652, 5)
[214]:
_ = influence_df \
    .query('lift_yes > 1.1') \
    .sort_values(['lift_yes'], ascending=False) \
    .groupby(['influencer', 'party']) \
    .size() \
    .sort_values(ascending=False) \
    .plot(kind='bar', figsize=(15, 3), title='CA, positive sponsorship lift greater than 1.1', ylabel='n')
Nanette Diaz Barragan is a Democat from CA’s 44th District.
[200]:
meta_pdf[meta_pdf['name'] == 'Nanette Diaz Barragan']
[200]:
| party | name | state | |
|---|---|---|---|
| district | |||
| CA_44 | D | Nanette Diaz Barragan | CA |
The table below shows the lift of positive sponsorship by Nanette Diaz Barragan.
[206]:
influence_df[influence_df['influencer']=='Nanette Diaz Barragan'] \
    .query('lift_yes > 1.1') \
    .sort_values(['lift_yes'], ascending=False)
[206]:
| lift_yes | lift_no | party | name | influencer | |
|---|---|---|---|---|---|
| district | |||||
| CA_43 | 6.699596 | 1.003815 | D | Maxine Waters | Nanette Diaz Barragan |
| CA_29 | 6.241822 | 1.012564 | D | Tony Cárdenas | Nanette Diaz Barragan |
| CA_34 | 4.982975 | 1.007346 | D | Jimmy Gomez | Nanette Diaz Barragan |
| CA_30 | 4.895481 | 1.012528 | D | Adam B Schiff | Nanette Diaz Barragan |
| CA_31 | 4.852449 | 1.007864 | D | Grace F Napolitano | Nanette Diaz Barragan |
| CA_35 | 3.575603 | 1.002823 | D | Norma J Torres | Nanette Diaz Barragan |
| CA_42 | 3.510453 | 1.002555 | D | Robert Garcia | Nanette Diaz Barragan |
| CA_08 | 2.611382 | 1.003312 | D | John Garamendi | Nanette Diaz Barragan |
| CA_33 | 2.578973 | 1.001102 | D | Pete Aguilar | Nanette Diaz Barragan |
| CA_36 | 2.117698 | 1.003409 | D | Ted Lieu | Nanette Diaz Barragan |
| CA_49 | 2.018340 | 1.002115 | D | Mike Levin | Nanette Diaz Barragan |
| CA_47 | 1.956330 | 1.003381 | D | Katie Porter | Nanette Diaz Barragan |
| CA_16 | 1.733226 | 1.000990 | D | Anna G Eshoo | Nanette Diaz Barragan |
| CA_32 | 1.579870 | 1.001121 | D | Brad Sherman | Nanette Diaz Barragan |
| CA_50 | 1.470807 | 1.000945 | D | Scott H Peters | Nanette Diaz Barragan |
| CA_52 | 1.465760 | 1.000894 | D | Juan Vargas | Nanette Diaz Barragan |
| CA_06 | 1.277089 | 1.000371 | D | Ami Bera | Nanette Diaz Barragan |
| CA_46 | 1.266964 | 1.000423 | D | J. Luis Correa | Nanette Diaz Barragan |
| CA_14 | 1.258381 | 1.000603 | D | Eric Swalwell | Nanette Diaz Barragan |
| CA_25 | 1.124468 | 1.000136 | D | Raul Ruiz | Nanette Diaz Barragan |
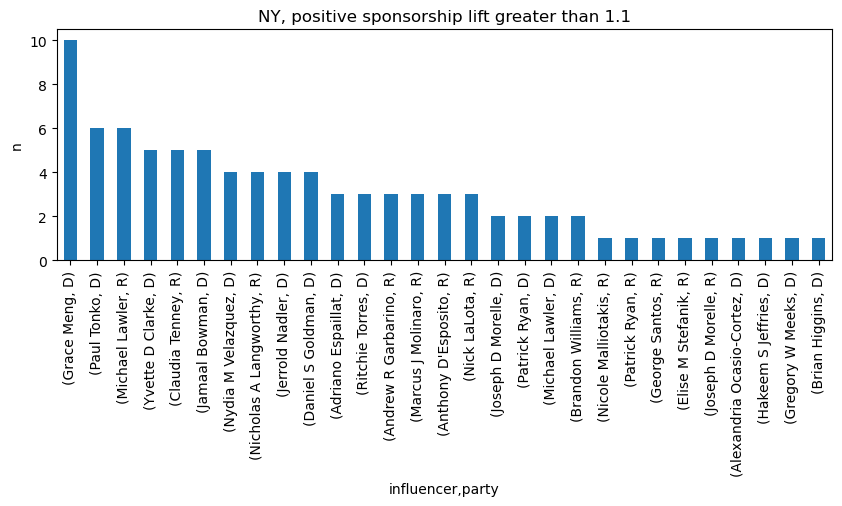
NY influencers
Here is the analysis for each Congress member in NY. Grace Meng provides the most number of lift for positive sponsorship in NY.
[218]:
_ = pd.concat([get_lift(_r['NY']['tree'], district) for district in meta_pdf[meta_pdf['state'] == 'NY'].index]) \
    .query('lift_yes > 1.1') \
    .sort_values(['lift_yes'], ascending=False) \
    .groupby(['influencer', 'party']) \
    .size() \
    .sort_values(ascending=False) \
    .plot(kind='bar', figsize=(10, 3), title='NY, positive sponsorship lift greater than 1.1', ylabel='n')
VA influencers
In VA, Gerald E Connolly provides the most positive sponsorship lift.
[219]:
_ = pd.concat([get_lift(_r['VA']['tree'], district) for district in meta_pdf[meta_pdf['state'] == 'VA'].index]) \
    .query('lift_yes > 1.1') \
    .sort_values(['lift_yes'], ascending=False) \
    .groupby(['influencer', 'party']) \
    .size() \
    .sort_values(ascending=False) \
    .plot(kind='bar', figsize=(7, 3), title='VA, positive sponsorship lift greater than 1.1', ylabel='n')